I read and saw an interesting blog today entitled
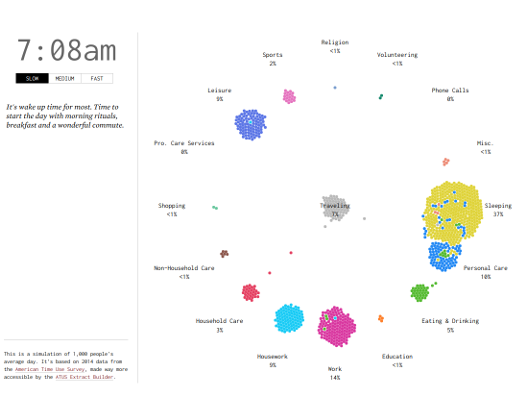
A Day in the Life of Americans. It’s an animated visualization of time spent by American’s during their day. It’s always interesting to see complex structured data visualized. Here they are using D3.js to perform the visualization.
If you like this, here’s another one:

